Workshop Title: Formatting Data
Formatting Data
Learning Objectives
- Learning best practices for recording and formatting data in spreadsheets
- Understanding the correspondence between columns and rows in spreadsheets and data structure
- Understanding the correspondence between spreadsheet cells, columns and rows and data observations and values
The purpose of this lesson is to demonstrate how to use a spreadsheet to import or record your data, organize your data, clean your data, and then export you data for use in another software program (such as R). In order to do all this, it is important to understand that computers are very literal. We have to tell the computer exactly how to interpret and read our data, or it won’t be able to use that data to produce reliable results.
This is why it’s extremely important to set up well-formatted tables from the outset- before you even start entering data from your very first preliminary experiment. Data organization is the foundation of your research project. Formatting will make it easier or harder to work with your data throughout your analysis, so it’s worth thinking about when you’re doing your data entry or setting up your experiment. You can set things up in a different way in spreadsheets, but it limits your ability to work with the data in other programs or have the you-of-6-months-from-now or your collaborator work with the data.
Structuring data in spreadsheets
There are two rules you should keep in mind when entering your data into any spreadsheet:
-
Each data cell is an observation that must have all the relevant information connected to it for it to stand on its own.
-
You must make it clear to the computer how the data cells relate to the relevant information and each other.
For instance we have data from the Sydney museum on all the objects in its collection. They keep track of things like the object’s name, registration ID, provenance, and size.
http://www.powerhousemuseum.com/collection/database/download.php
If they were to store the data about the object’s size like this
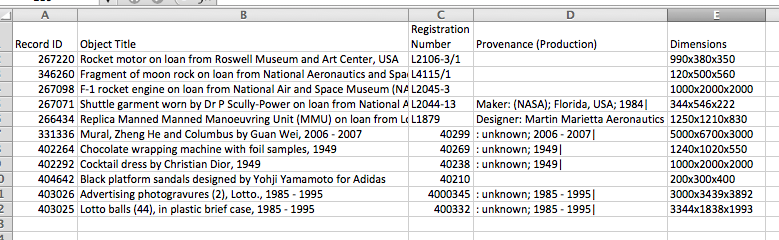
they’d have a problem. One problem here is that three dimensions (height, width, and length) are all in the same column). If we wanted to search for an object with a certain height, we would have difficulty doing this. Instead, each measurement or dimentsion should be in its own column.
Columns for variables and rows for observations
The rule of thumb, when setting up a datasheet, is columns = variables, rows = observations, and cells = data or values.
One strong reason for this given our need to be able to export this data to other programs is that most programs that work with data expect each line to be an observation with a consistent format that will allow it to access the recorded variables by the order they are in.
Therefore, instead of the consolidated example above, we should have the separated example below:
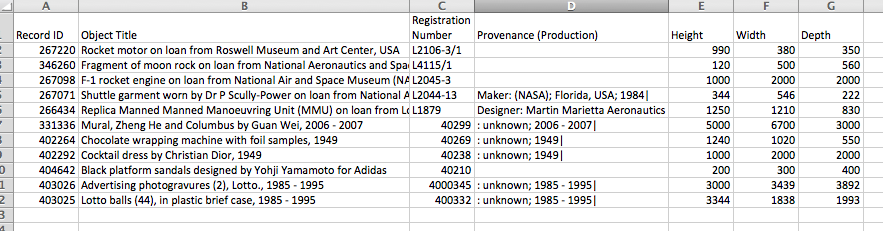
This will make it easy for a computer to do something find all objects with a height greater than 1000 because all the heights are separate from the other dimensions within each row.
Exercise
You have just taken over as the new curator and the museum director is leading an initiative to give the museum an online presence. To support this you’ll need to be able to export data to other programs. The past two curators each logged their data using their own formats and practices. Clean-up the sample data set to support this initiative.
- With a partner, download the data and open it in a spreadsheet program.
- Make a list of changes needed that will allow for easier readability or export.
- Make the changes.
After you go through this exercise, we’ll discuss as a group what you think was wrong with this data organization and how you fixed it.
Previous: Introduction Next: Common formatting mistakes