Visualizing Volumetric Data
Overview
Teaching: 20 min
Exercises: 5 minQuestions
How to visualize volumetric data?
Objectives
Learn how to compute density maps
Learn how to visualize volumes
Visual representations of volumetric data
VMD has the ability to compute and display volumetric data. Volumetric data sets represent parameters whose values depend on their location in 3D, such as density, potential or solvent accessibility. Volumetric datasets store data as 3-D grids. Volumetric data can be visualized by VMD as slices, as isosurfaces, or by using volumetric data to color objects. Plugins for creating and analyzing volumetric data are also available in VMD.
- VMD has the ability to compute and display volumetric data.
Creating density maps
Let’s use the file workshop_vmd/example_03/bcl2-1.pdb
Load this file and compute density map using Volmap Tool:
- Go to
Extensions–>Analysis–>Volmap Tool - Change
selectiontoallandresolutionto0.5 - Press
Create Map
Our molecule now has one volumetric data set associated with it, and isosurface representation of this map is automatically created.
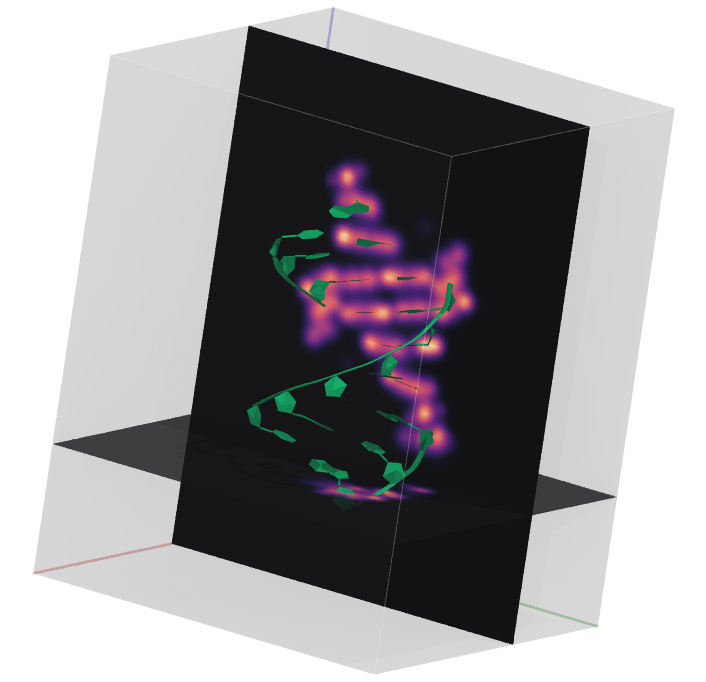
Using slices to visualize volume
- select
VolumeSliceinDrawing Method - select
VolumeinColoring Method - select
Slice angle–>Y
The color scale can be set in Graphics–>Colors–> Color Scale. Select Sequential–>Plasma in Method.
Play with the Slice Offset slider, which adjusts the y-coordinate of the slice. Different colors represent different numerical values of the volumetric data, in this case mass density.
Make slices for the x- and z-directions as well, and rotate you view with the mouse so that all three planes are visible.
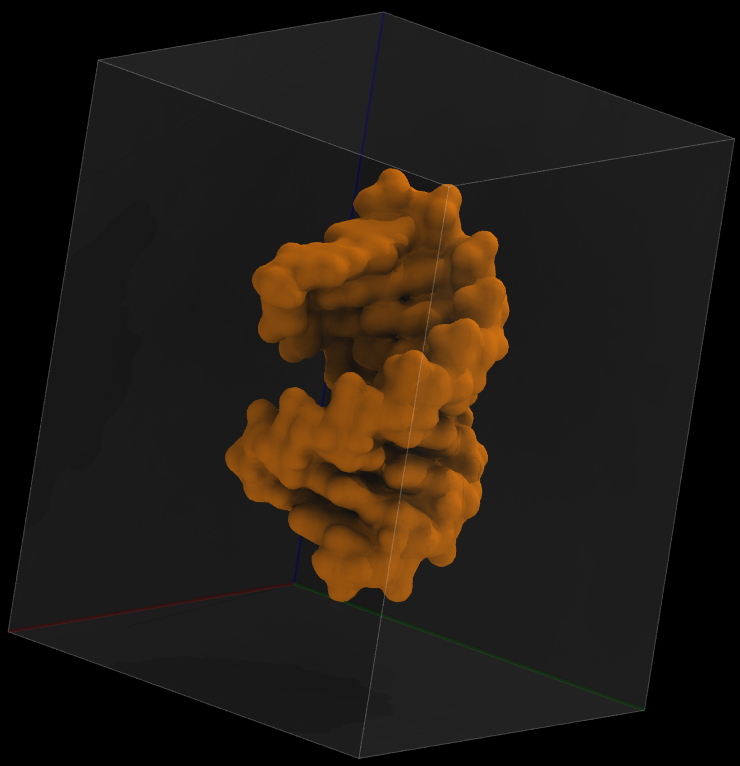
Using isosurfaces to visualize volume
For 3D surface representation of the volumetric data follow the following steps:
- Create a new representation using the
Isosurfacedrawing method. - In the Draw menu, select
Solid Surface.
Now, you can see a surface of constant volumetric value, chosen using the Isovalue slider. As you choose higher values, you see the surface shrinks down around a core where the most average mass was located.
- Select
isovalue 0.1, and change material toGlassBubble. Then create another isosurface withisovalue 2.2and change its color.
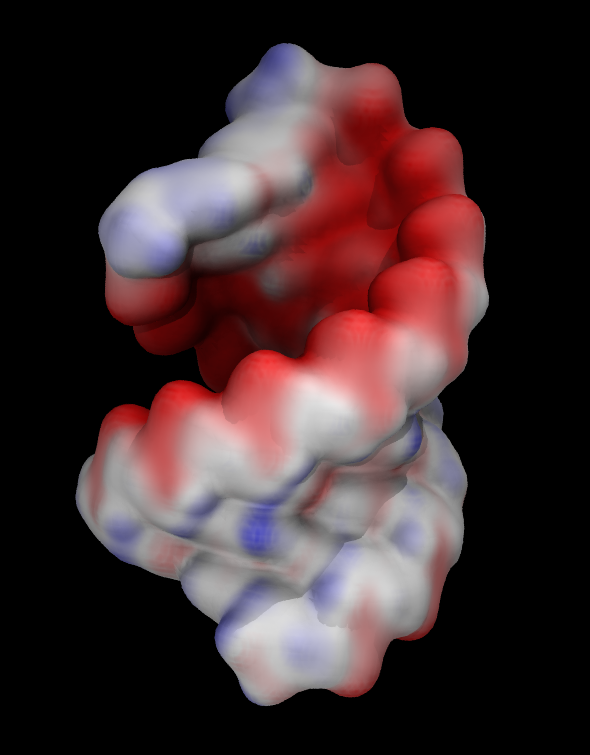
Coloring objects by volumetric data
Another common way to represent volumetric data is by coloring other representations based on it. For example you can color molecular surface by electrostatic potential.
- As an example we will use electrostatic potential saved in the file
workshop_vmd/example_03/bcl2-1_pot.dx
To prepare potential file from the pdb file I first used pdb2pqr web server to prepare pdb file with charges and radii needed for calculation of electrostatic potential. Then I used APBS Electrostatics VMD plugin to compute electrostatic potential around RNA molecule. I will discuss these calculations in detail later. For now we will simply use precomputed potential file as a visualization example.
- Delete the loaded molecule and load bcl2-1.pdb again. Then load data file bcl2-1_pot.dx into the molecule.
- Create
SurforQuickSurfrepresentation. - Color it by volume
- Adjust
Color scale data rangein theTrajectorytab. Try [-50 50].
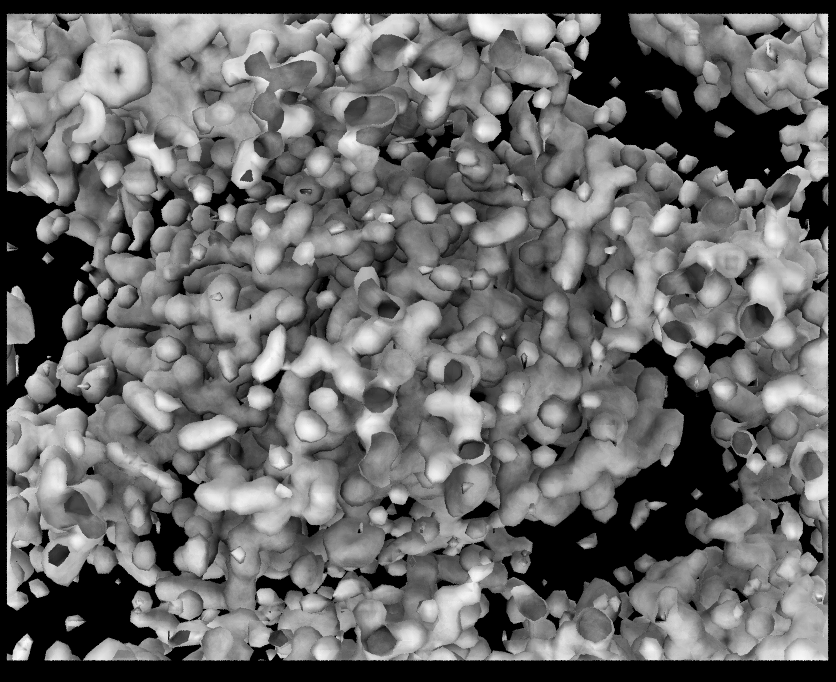
Visualizing electron density maps
The electron density map represents the fit between the structural model and experimental data from an X-ray structure determination. Scientists commonly use 2fo-fc and fo-fc electron density maps. The fo-fc map shows only the electron density poorly represented by the model, while the 2fo-fc map includes electron density around the model. We will be using the 2fo-fc map for this demonstration.
- Electron density maps calculated using the program DCC can be downloaded in DSN6 format from Structure Summary pages.
Example PDB file is 7xcq.
- Download two files:
The files are available in the folder workshop_vmd/example_04
- Load 7xcq.pdb and then load 7xcq_2fo-fc.dsn6 map into the 7xcq molecule.
- Create isosurface representation and set the isovalue to 1.0.
The volume map is too big, so the figure is very busy. By focusing on a small area of interest, visualization can be significantly improved. When choosing regions of interest in volumetric data, VMD provides two options.
 Whole Map Whole Map |
 Clipping planes Clipping planes |
 Volime Tool Volime Tool |
Clip Tool
Clipping planes allow for the slicing of a 3D model along a plane. Each molecule can have up to 6 different clipping planes, which can independently be set on or off.
- To get a clear view, use clipping planes to remove volume in front of and behind your region of interest.
Clipping Plane Toolis underExtensions->Visualization. - Check
Normal follows viewbox to orient clipping planes perpendicular to the view direction.
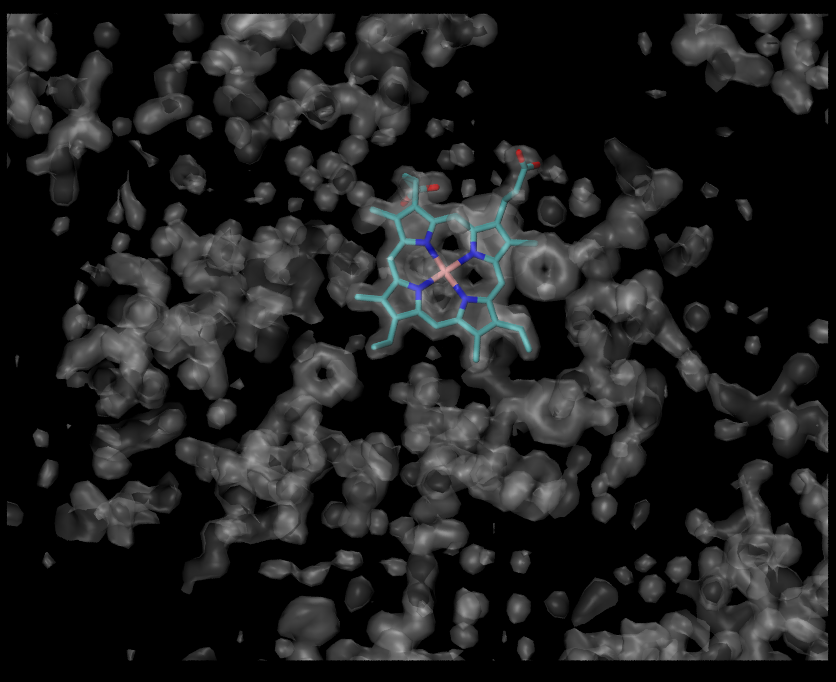
Let’s focus on the HEM. The first step is to orient it in the plane of the screen. Then in the clipping plane tool check the box Normal follows view and activate two clipping planes. Uncheck Normal follows view, rotate the molecule to look at the HEM from its side and adjust positions of the clipping planes.
Volume Tool
- Volume Tool provides many functions for working with volume maps.
- Using the “mask” function you can select a region within a cut-off distance
The “mask” function removes all voxels from an input map that fall outside the given cutoff from a set of atoms. This functionality is available only in VMD command line.
voltool mask <selection> -mol <molID> -vol <volID> -cutoff <cutoff distance>
The voltool operates on selections of atoms, so we need to create a selection.
Let’s select HEM atoms:
atomselect top "resname HEM"
Print all available selections:
atomselect list
You may have more than one selection, so let’s confirm that atomselect0 is the selection we want:
atomselect0 text
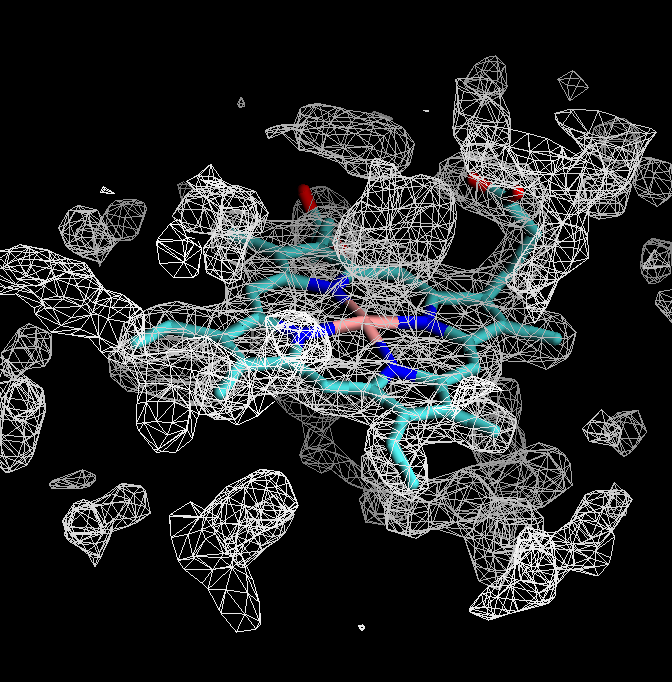
Visualize electron density around HEM:
voltool mask atomselect0 -mol 0 -vol 0 -cutoff 3
Selecting an area of interest with voltool
Visualize electron density around TYR103, or any other residue using voltool.
Key Points